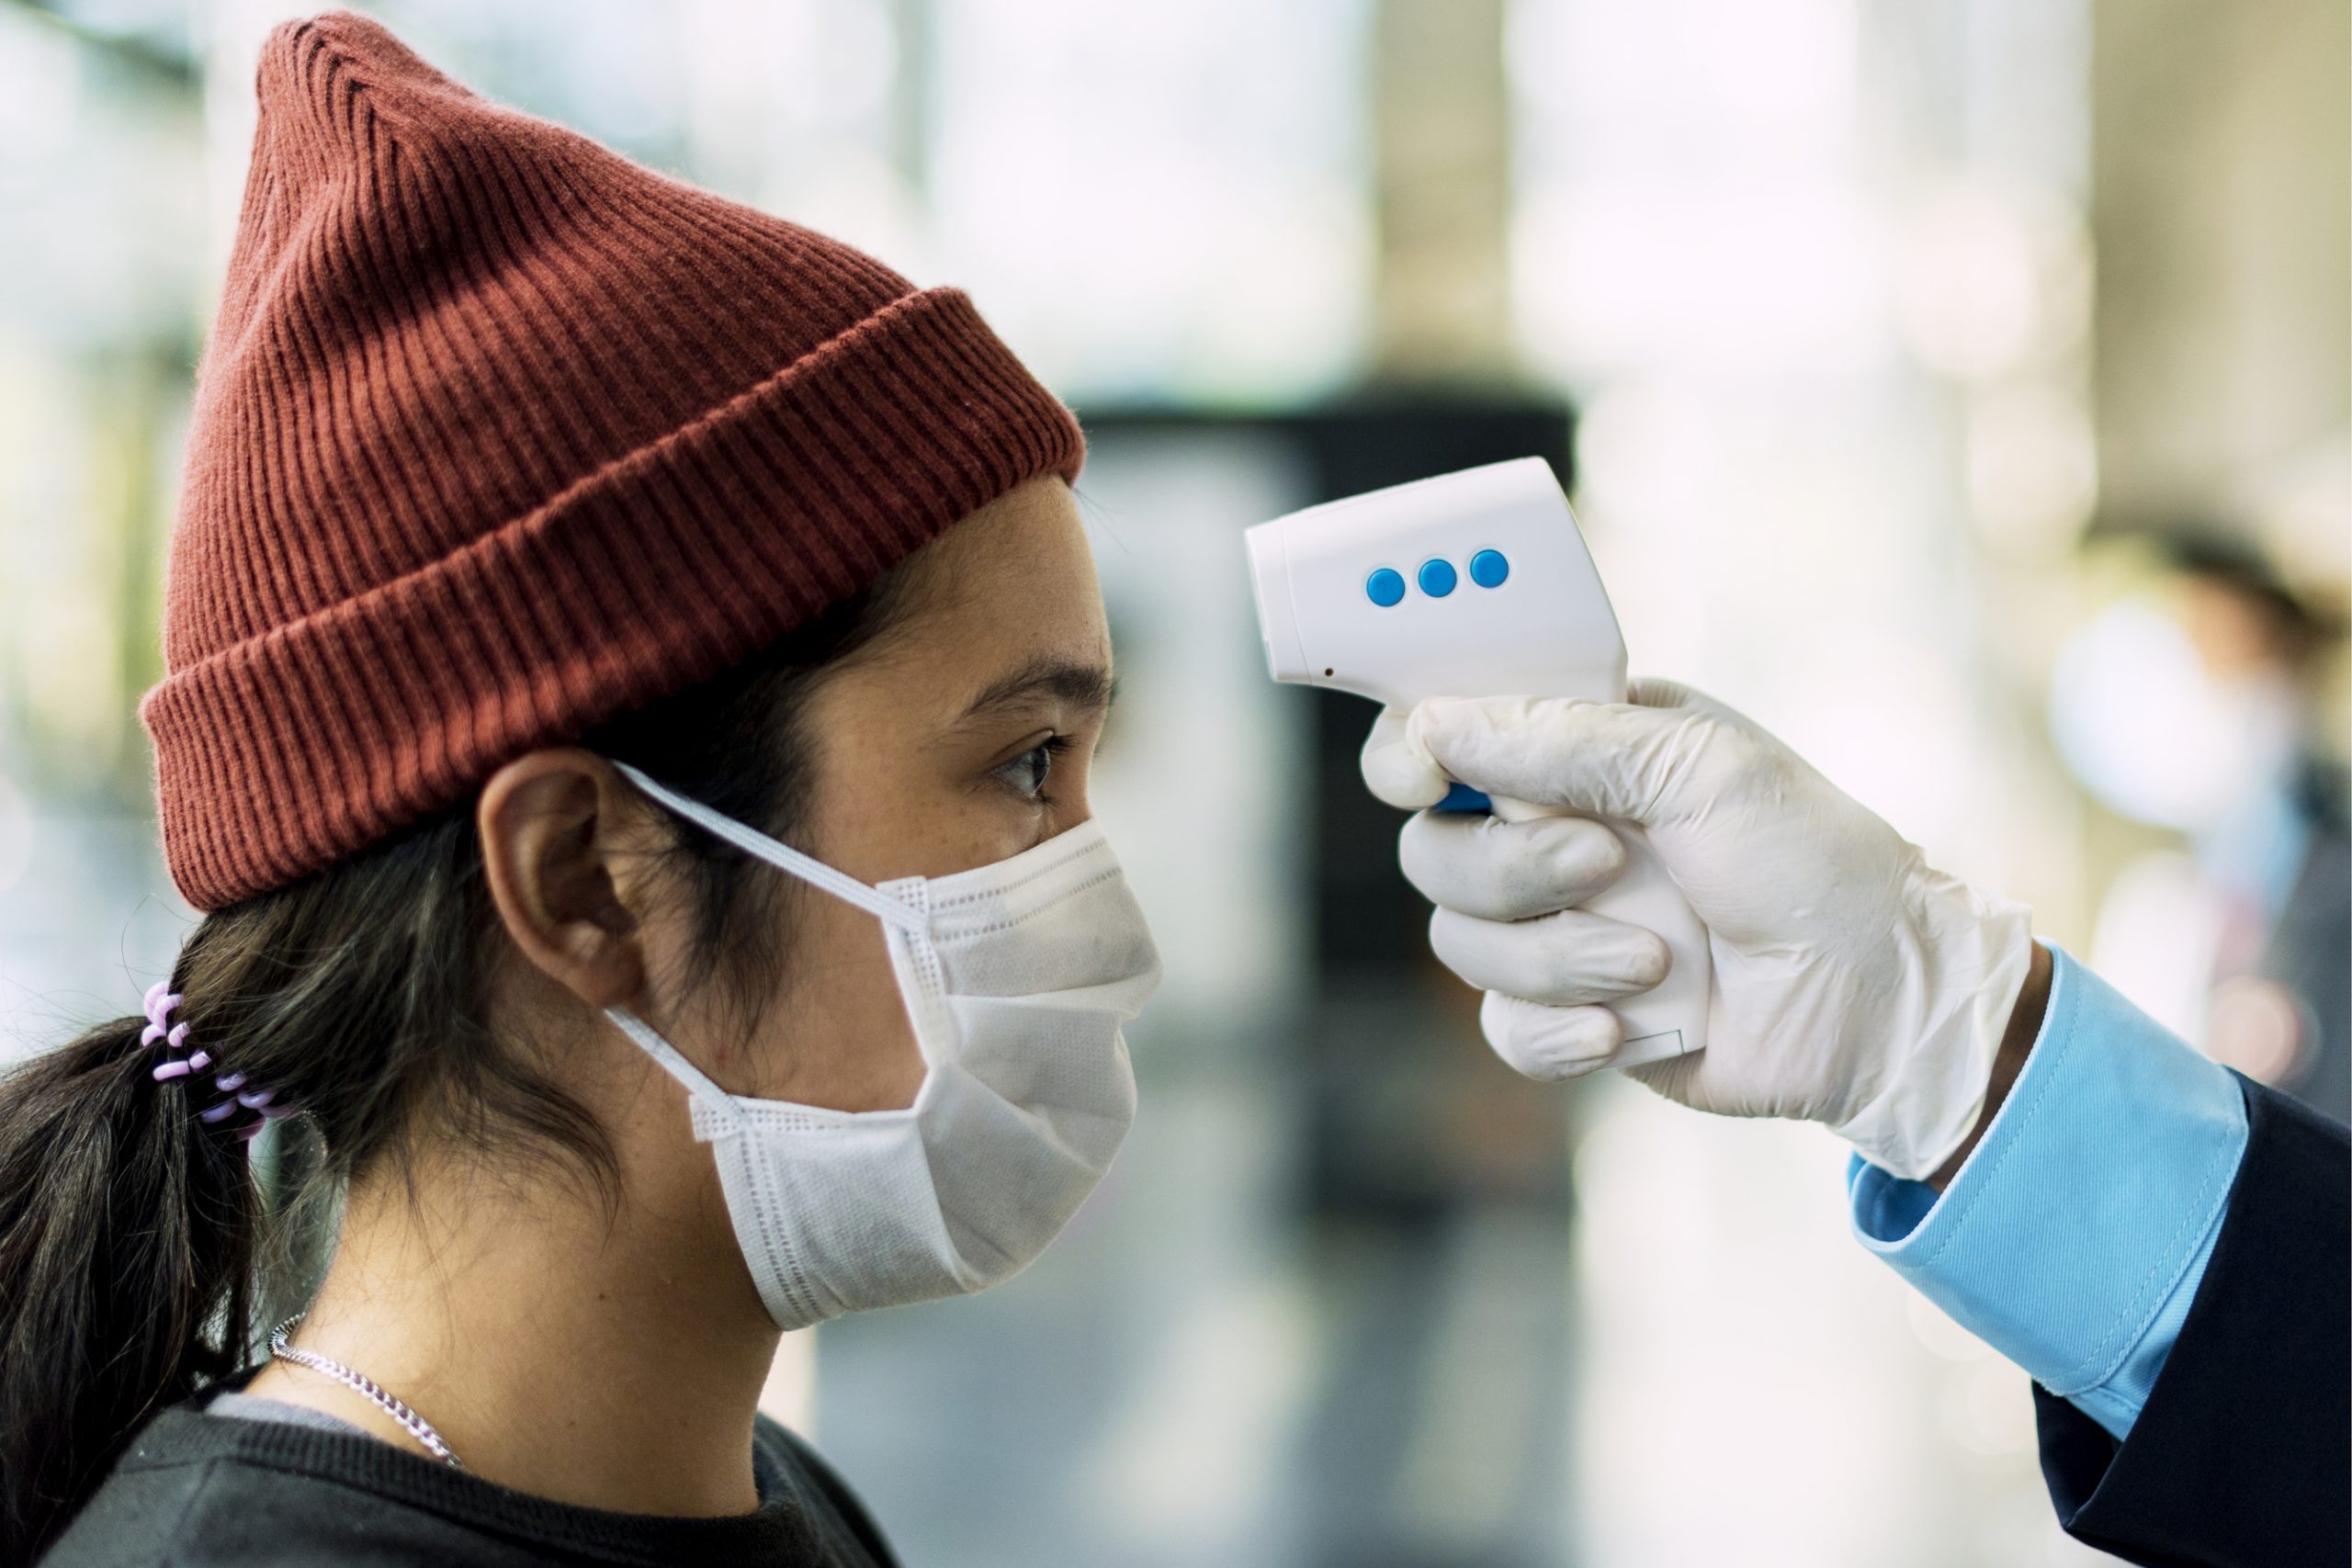
Image by rawpixel.com on Freepik
Researchers can use computer vision technologies to work backward from COVID-19 mortality data to understand how infection rates changed on the day a lockout or similar action was implemented. The method could be valuable in future epidemics and pandemics. The study was published in Science Advances on July 14th.
Coauthors In the first year of the epidemic, Leonor Saiz, professor of biomedical engineering at the University of California, Davis, and Jose Vilar, University of the Basque Country, Spain, intended to see the impact of non-pharmaceutical interventions such as social distancing, lockdowns, and masking. They calculated the daily rate of new cases by analyzing daily death reports from European countries such as the United Kingdom, Italy, Spain, Denmark, and Switzerland.
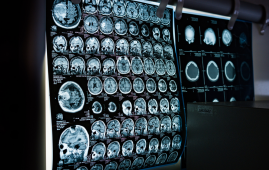
The daily incidence of infection is the input, and the fatality rate is the output. An inverse process is defined by mathematicians as taking an outcome and working backwards to determine the input. In medical image processing, for example, you may need to improve image quality. Mathematicians and engineers have discovered strategies to restore a blurred image to its previous clarity and sharpness. This is known as deconvolution.
According to Saiz, calculating the daily rate of new infections from daily death rates is a challenging challenge. The majority of COVID-19 cases are not fatal, and when they are, death can occur anywhere between 10 and 30 days after infection. This indicates that the output signal is smeared or fuzzy over time, just as an image seen through cloudy glass may appear blurry or warped in space.
Epidemiology uses deconvolution.
Saiz and Vilar created an epidemiological deconvolution method. The model may work backwards from death rate data (output) to daily incidence rate (input) using a neural network that includes virus behavior and infection dynamics.
“We borrowed a concept from vision technology to apply it to epidemiology,” Saiz said.
The researchers validated their model by examining the impact of non-pharmaceutical interventions (i.e., interventions other than vaccines or pharmacological treatments) during the first year of the pandemic. Because such measures were often implemented over an entire country on the same day, they sought to determine if their model could predict when they would be implemented.
They were able to see, for example, the days lockdowns were imposed and withdrawn in England within a day of their actual date. In Spain, they could see how infections increased when travel restrictions were abolished, and in Italy, they could see how illnesses increased on the day in October 2020 when face masks were required outside.
The method could be used to evaluate the effectiveness of certain measures or combinations of procedures, such as quarantines and mask regulations during COVID-19 outbreak, in lowering infection rates.
“We can at least have confidence that lockdowns decreased infection transmission instantaneously,” Saiz said. The Government of Spain is supporting this work through grants.
 Stroke Rehabilitation: Early High-Intensity Therapy Findings
Key Highlights High-intensity therapy within 2.
 TRPM8 Cold Sensation Mechanism Explained for Pain Care
Quick Summary TRPM8 ion channel converts.
 Gum Recession from Snus Confirmed, Caries Risk Debated
Key Highlights Snus use is strongly.
 Hypertensive Disorders of Pregnancy: Role of Daily Activity
Key Points Summary Limiting sedentary time.
 Climate Change Drives Dengue Outbreaks Globally
Key Takeaways Extreme weather significantly increases.
 Teen Driving Risks: Parents Underestimate Safety Threats
Key Takeaways Teen driving risks remain.
 PFK Enzyme Dual Role in Metabolism and Cell Cycle
Key Highlights Phosphofructokinase (PFK Enzyme) shows.
 Exercise During Chemotherapy Supports Brain Health
Key Points Summary A nationwide clinical.
 Invasive Cosmetic Procedures Raise Patient Safety Concerns
Key Summary Experts publishing in The.
 Oligometastatic Pancreatic Cancer: New Global Consensus
Key Points Summary An international expert.
Leave a Comment