Study: Targeted spectroscopy in the eye fundus
Researchers demonstrate the multimodal functioning of targeted ocular fluorescence spectroscopy in vitro and in vivo in a recent paper published in the Journal of Biomedical Optics.
Some common anatomical and functional changes in the eyes, particularly the eye fundus, occur as a result of ocular disorders such as diabetic retinopathy (DR), age-related macular degeneration (AMD), and glaucoma. Neurological illnesses such as Alzheimer’s and Parkinson’s can cause retinal alterations such as thinning of the retinal nerve fiber layer (RNFL) and changes in hemodynamics.
Because of the highly varied features and composition of the eye fundus, biomarkers may spread widely or localize to specific regions. -amyloid plaques, for example, disseminate throughout the retina of AD patients, whereas DR patients have isolated hemorrhages.
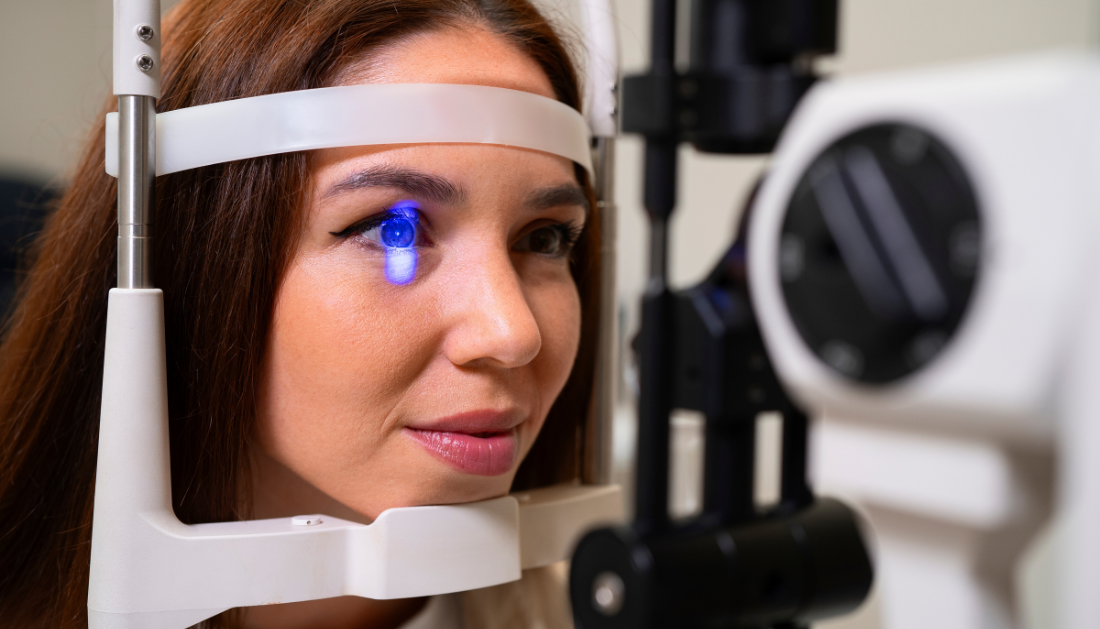
When compared to focused ocular diffuse reflectance spectroscopy (DRS), traditional imaging approaches do not provide adequate data on retinal alterations caused by these disorders. Ocular DRS technologies allow for spectral examination of specific areas of the eye fundus, such as the optic disc, peripheral retina, and fovea, at wavelengths ranging from 500 to 800 nanometers (nm).
Diffuse reflectance and fluorescence spectroscopy can also reveal how factors such as lipofuscin accumulation, RNFL structural alterations, blood absorption spectrum, and melanin spectral profile affect the optical properties of retinal tissues.
Concerning the research
The current work uses a reference target and a model eye to uncover the key aspects of targeted ocular spectroscopic technology in vitro. The reference target was an ultrahigh-definition screen with an eight-color grid, with the fundus camera placed in front of it and gathering only light generated by the screen. The OEMI-7 eye model, with a seven mm pupil that accurately simulates the human eye, aided in the validation of these DRS acquisitions.
Following that, in vivo imaging and DRS were utilized to determine blood oxygen saturation (StO2) in the optic nerve head and parafovea of eight healthy study participants who gave informed consent prior to the trial. These people were between the ages of 27 and 35, had no systemic disorders or medications, and had normal eye test results.
The pointing light emitting diode (LED) lit the precise location of the actual region of spectral acquisition (ROSA), allowing the camera to record it. Following combined imaging and targeted spectroscopy, a two-step acquisition strategy was adopted.
The ROSA image segmentation was used to determine the location of the DRS acquisition region. Spectra were collected by moving the ROSA to six different positions inside the reference target’s field of vision for spectral analysis.
For green fluorescence imaging, bandpass filters isolate the excitation illumination. Long-pass filters, on the other hand, allowed for the exclusive imaging and spectral collection of fluorescent light.
Spectral analysis required three processing phases in which ambient light spectral contributions were removed from the spectrum and the effect of the illumination source spectrum was assessed. After that, the light spectrum was adjusted to account for variances in signal strength.
The study’s findings
The reflectance spectra from blood vessels, the retina near the optic nerve head, the optic nerve head, and the retina distance from the optic nerve head (D) were collected by the model eye. The reflectance spectra of blood vessels and the optic nerve were noticeably different. The model eye also assisted in fluorescence analysis for four locations, with just the blood vessels and optic nerve head providing fluorescence signals.
All eight participants had five-second DRS acquisitions at the optic nerve head and parafovea, which corresponded to 13 obtained spectra. Interindividual heterogeneity was evident in the average absorbance spectra for both locations.
All earlier methods for assessing blood oxygen saturation in the eye had limited sensitivity and, as a result, could only be used to quantify StO2 relative to big blood arteries in the eye fundus. The current investigation found that blood oxygen saturation tests taken in different areas resulted in varying StO2 values.
The parafovea had lower oxygen saturation and more interindividual variability in StO2 than the optic nerve head, with values ranging from 30.4-58.4% and 62.1-69.7%, respectively.
An ocular oximetry method was developed for in-vivo spectra and exhibited the ability to identify the presence of distinct fluorophores/chromophores that can be utilized to diagnose various retinal diseases. This method selectively targeted specific regions of interest identified using wide-field fluorescence and acquired a complete emission spectrum profile of these molecules.
Conclusions
This study’s multimodal technology permitted concurrent and continuous imaging as well as targeted spectroscopy in the eye fundus. Furthermore, it demonstrated good sensitivity, spectral resolution, and a fast acquisition speed for detecting retinal biomarkers. It’s notable because other techniques, like hyperspectral imaging, make a trade-off between spectral resolution and acquisition time.
Furthermore, this technique acquired distinct spectrum characteristics in the various locations evaluated in vitro and in vivo. To summarize, focused ocular spectroscopy has the potential to open up new avenues for diagnosing and treating eye illnesses in the future.
For more information: Targeted spectroscopy in the eye fundus, Journal of Biomedical Optics, https://doi.org/10.1117/1.JBO.28.12.126004
 Rapid-Acting Antidepressants Share Neuroimmune Pathways
Key Points Researchers identified common neuroimmune.
 SuperAgers and Alzheimer’s Disease Risk Explained
Key Summary SuperAgers maintain exceptional episodic.
 Inherited Genetics and Cancer Susceptibility Explained
Key Summary Inherited genetics directly influences.
 Multiple Sclerosis Mortality Trends Reveal Care Gaps in the USA
Key Points Multiple sclerosis mortality in.
 Drinking Water With Meals Linked to Higher Food Intake
Key Points Summary A new Appetite.
 Cyclosporiasis Risk: Who Faces the Highest Threat?
Key Summary Cyclosporiasis cases are increasing.
 EP2 Receptor Research Opens New Path for Healthy Aging
Key Points Researchers identified the EP2.
 Obesity-Associated Leukemia Linked to Inflammation
Key Takeaways Researchers identified how obesity.
 Chronic Xanthan Gum Alters Gut Microbiota and Colon Health
Key Points Chronic xanthan gum consumption.
 Calcific Aortic Valve Stenosis Linked to Gum Disease Bacteria
Key Points Researchers identified a potential.
Leave a Comment